
Detecting Weak Layers with The Snow Scope Probe
The Snow Scope Probe is a tool created to rapidly document snowpack stratigraphy over space and time. By measuring a snow profile in under 10 seconds, you are able to measure orders of magnitude more snow profiles than you would by hand in a snowpit. However, all of this data is meaningless unless you are confident that these measured snow profiles are accurate and measuring the layers you care about. For avalanche applications, this means detecting and measuring weak layers.
Experimental Setup
To demonstrate the power of the Snow Scope Probe in detecting weak layers, we set up a controlled experiment to determine how thin of weak layers can be measured by the probe. First, we dug a pit and artificially cut 6 “weak” layers into the snowpack spaced about 15cm apart with a 1.5mm thick snow saw.
Next we collected 16 snow profiles with 4 different Snow Scope Probes, making sure to probe through the “weak layers” each time. To help isolate effects of spatial variability in the snowpack, these profiles were taken as close together as possible. Additionally, the top surface snow was cut flat, to make sure we were measuring weak layers at the same depth with each profile.

Results
The results of these profiles were quite promising. In each of the 16 profiles collected, all 6 “weak layers” were detected. Below shows one of these Snow Scope Profiles with the weak layers identified - they are quite obvious in the profile.

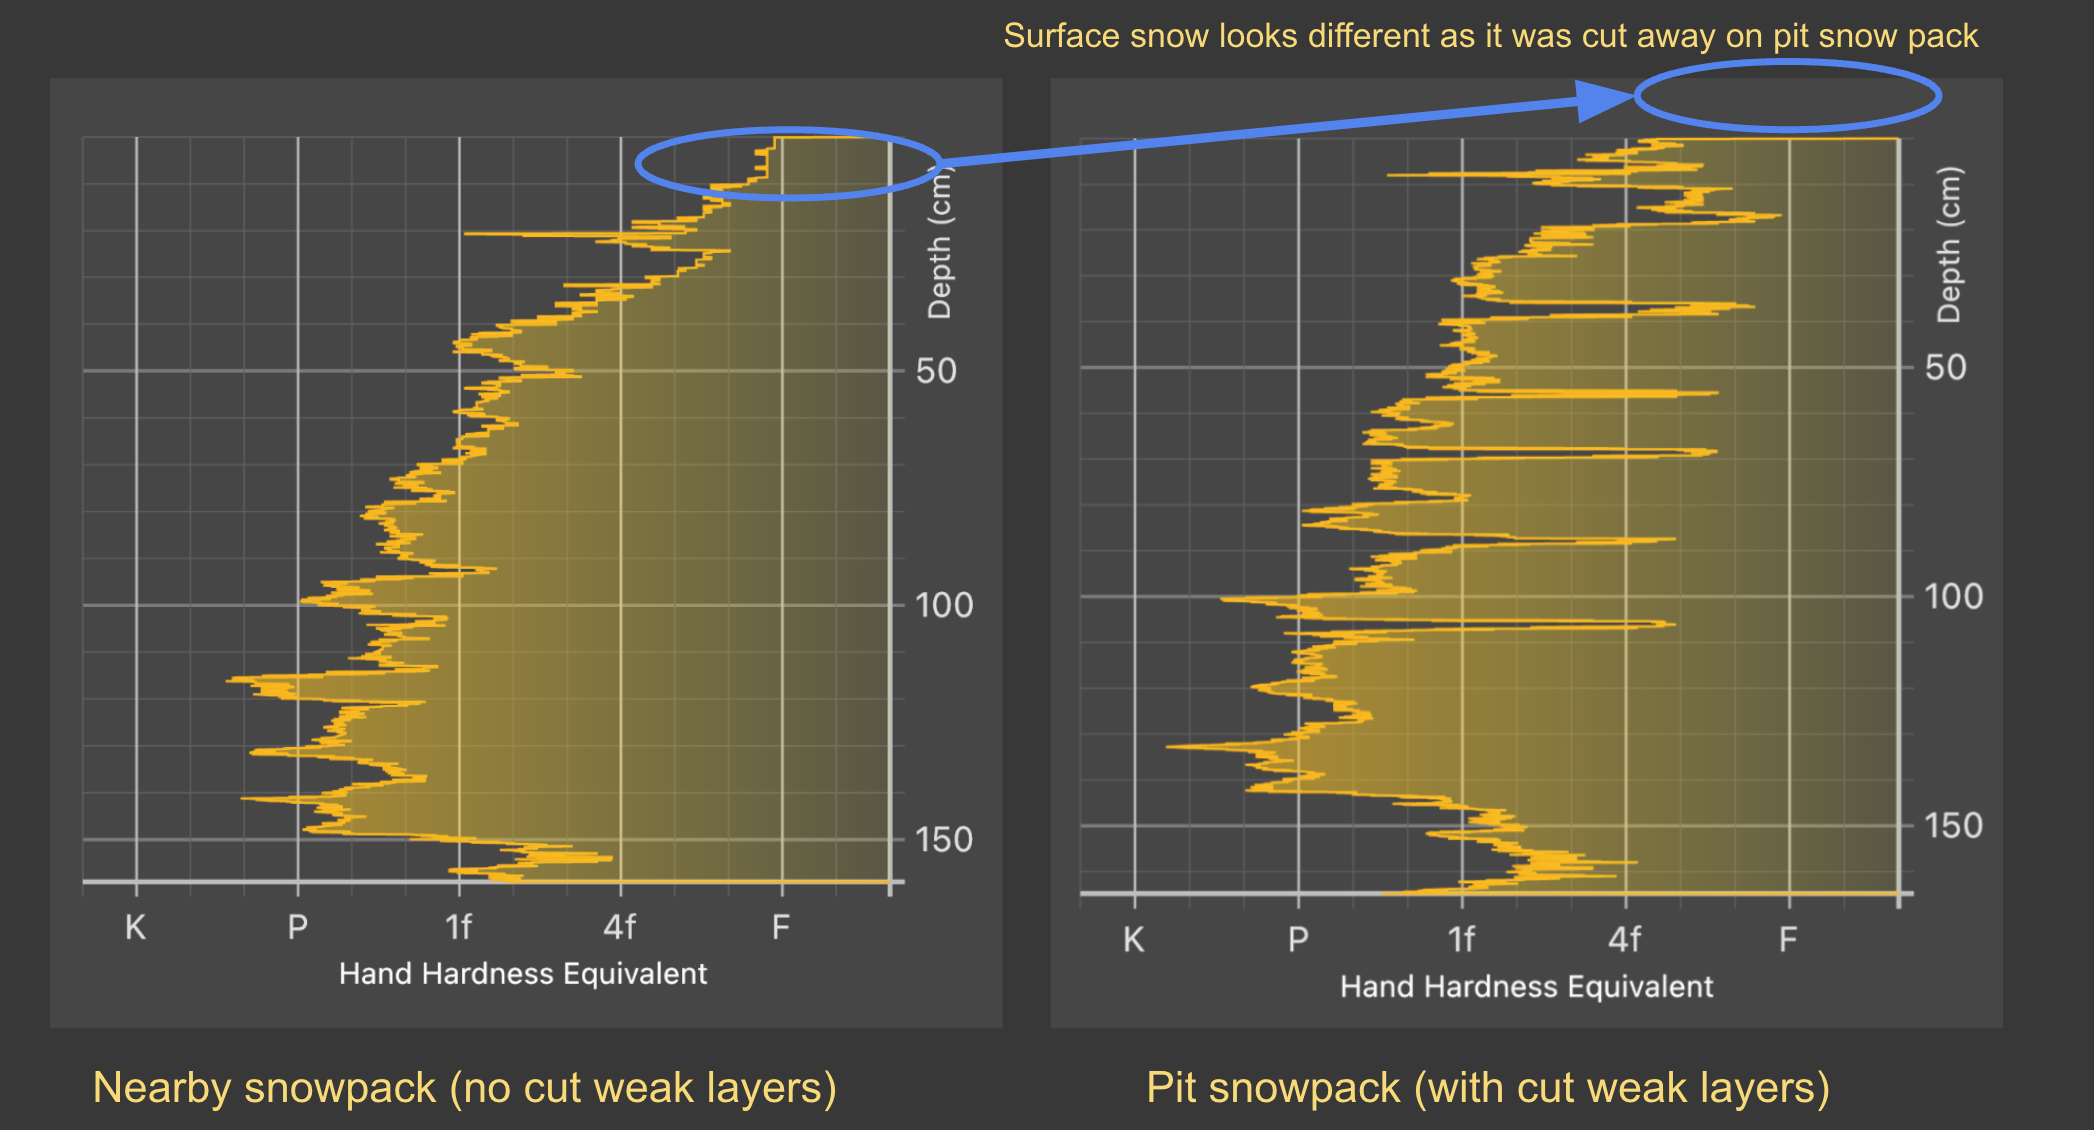
These layers are also very obvious when compared to a profile of the same snowpack without the weak layers cut. The image below compares a profile taken right next to the pit (no weak layers), with one from the pit (weak layers cut). The only obvious difference other than the presence of weak layers is the surface snow missing on the pit snowpack, as we cleared that away to make a flat pit top.
As a user in a real world situation looking for weak layers, these two profiles and presence/absence of weak layers would be very distinguishable.
Depth Accuracy
While the most important finding of this test was that across all 4 Snow Scope Probes (16 total snow profiles), all 6 weak layers were identified in each of them (96/96 identification success!), we also wanted to look at the depth accuracy of identifying these layers.
The table and chart below show the results of this: snow scope profile measured weak layer depths compared to the actual depths the weak layers were cut at (as measured on the pit wall).
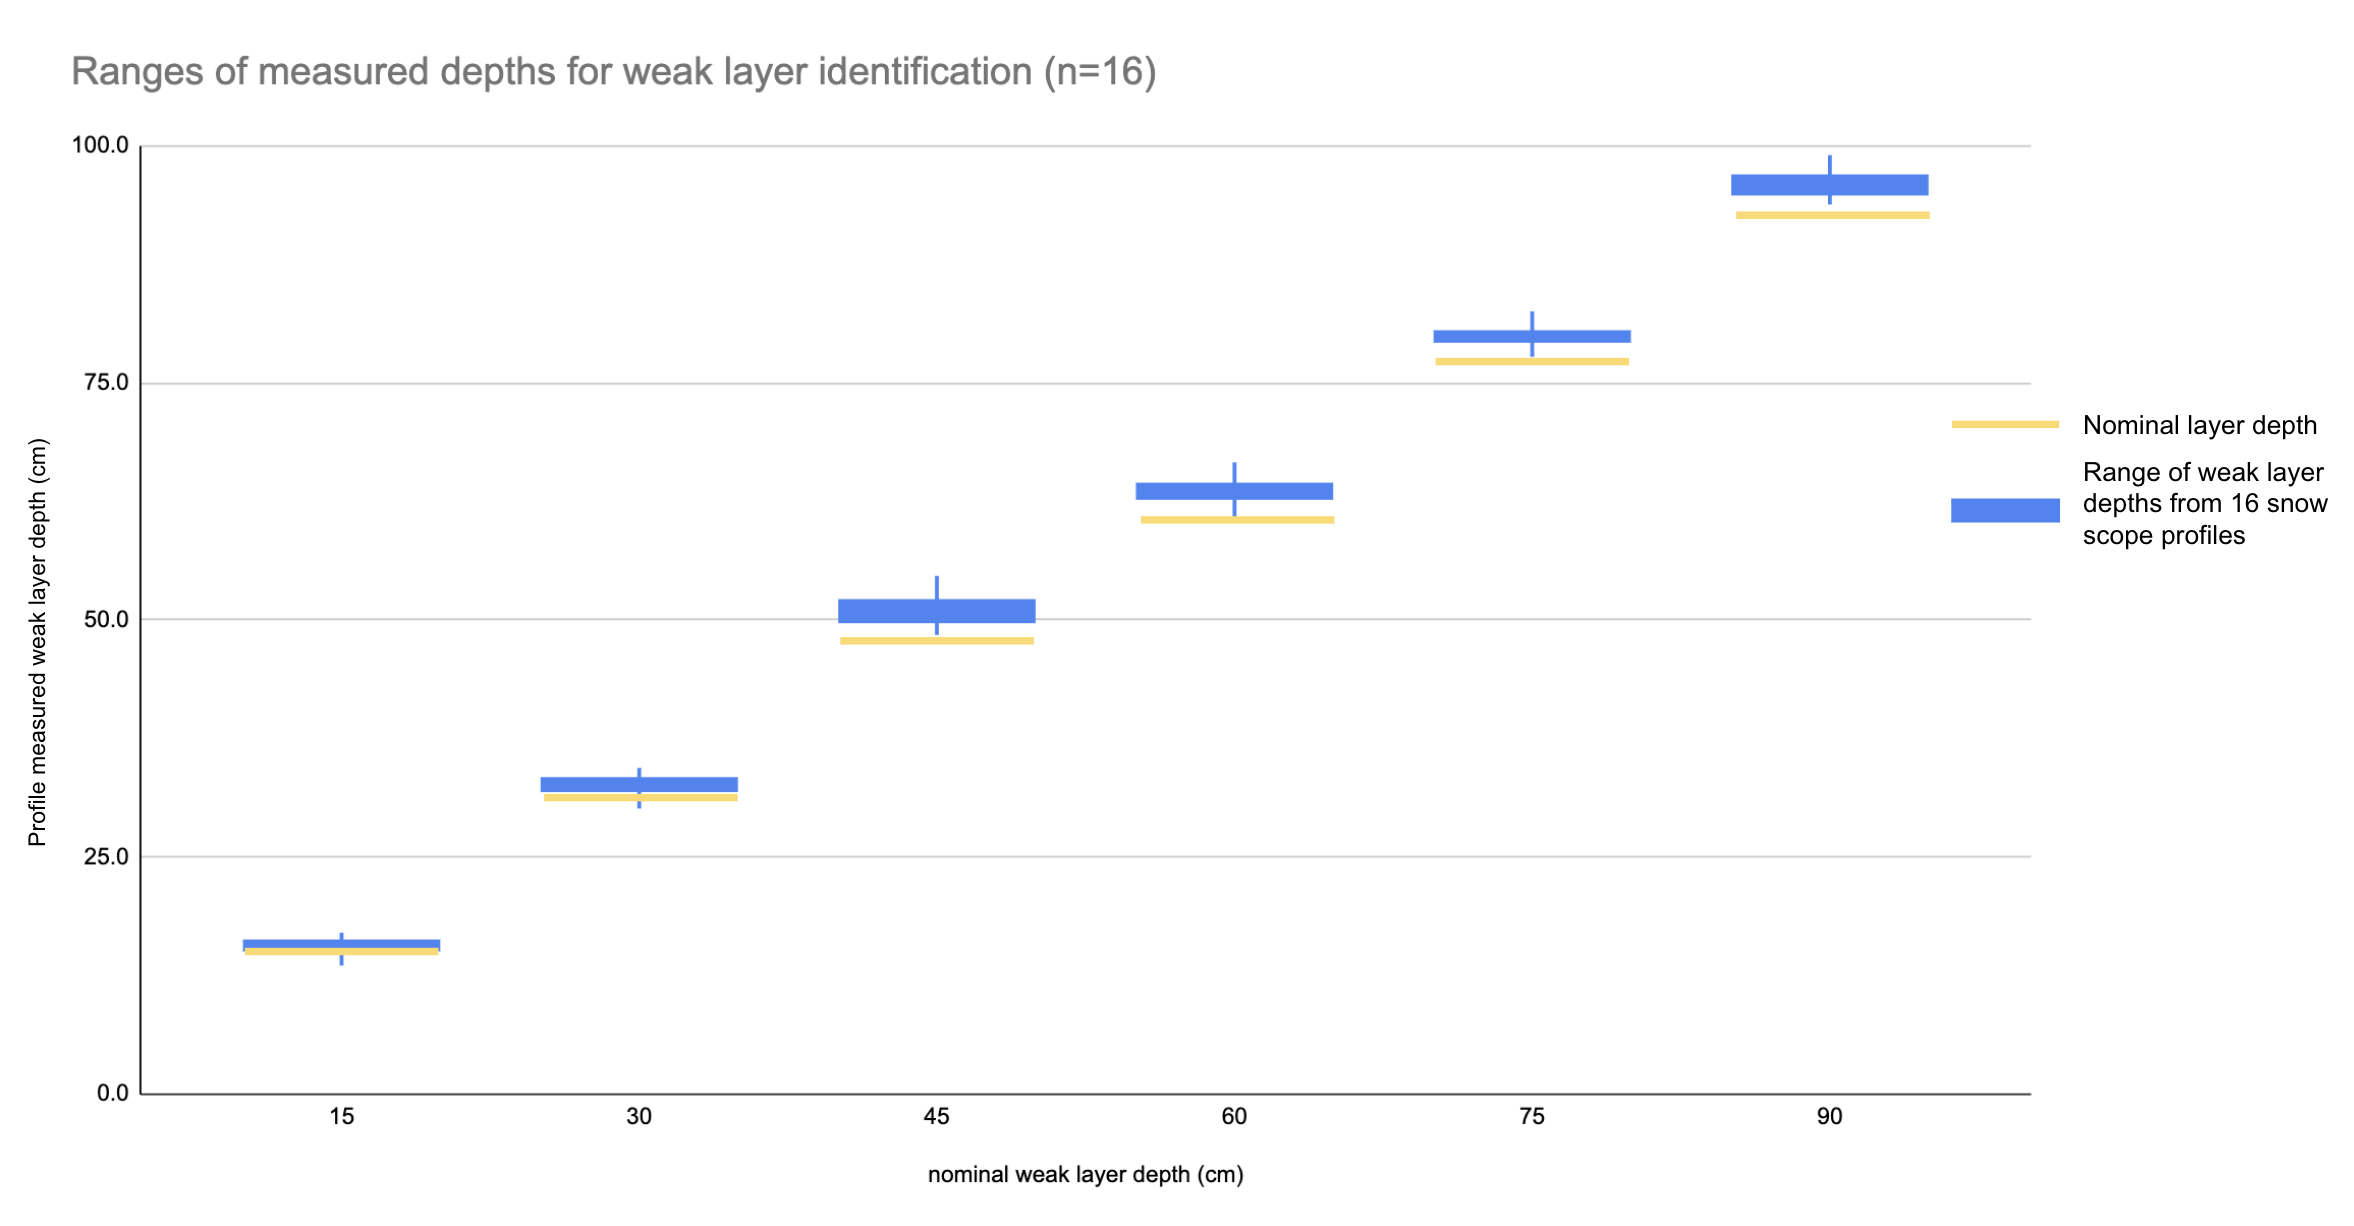

A few takeaways from this depth accuracy analysis are:
1. The measurements of depths across 16 different profiles from 4 different Snow Scope Probes are tightly clustered (maximum difference for measured depths of each layer is 3-5cm). Due to variability in where those layers are actually under the snow surface means that only a portion of this tight error range is attributable to the probe, so the true depth precision of the snow scope probe is likely higher than this 3-4cm range (see our depth specs based on hundreds of profiles).
2. The measured depths of these weak layers closely tracked the actual depths of the weak layers, although in some cases the average measured depth was up to 4cm deeper than the nominal layer depth as measured on the pit wall. This is likely attributable to the weak layers not being cut completely parallel to the snow surface and being deeper than the nominal depth as measured on the pit wall.
Force Accuracy
Finally, we were interested in seeing how accurately the Snow Scope Probe could measure the hardness of these “weak layers”. In theory, the hardness of each of these weak layers should be 0, as the “weak layers” in this case were air gaps cut into the snowpack.
In reality, the measured forces for each of these weak layers was greater than 0 as shown in the plot of average and ranges for each of the 6 weak layers shown below. The Y-Axis is plotted in kPa (measurement of pressure) that can be correlated to “hand hardness”. The total range of snow from Fist hard to Knife hard snow ranges from about 0-1000 kPa, so this plot is showing just a small fraction of that range (0-60kPa) in the Fist hard range.
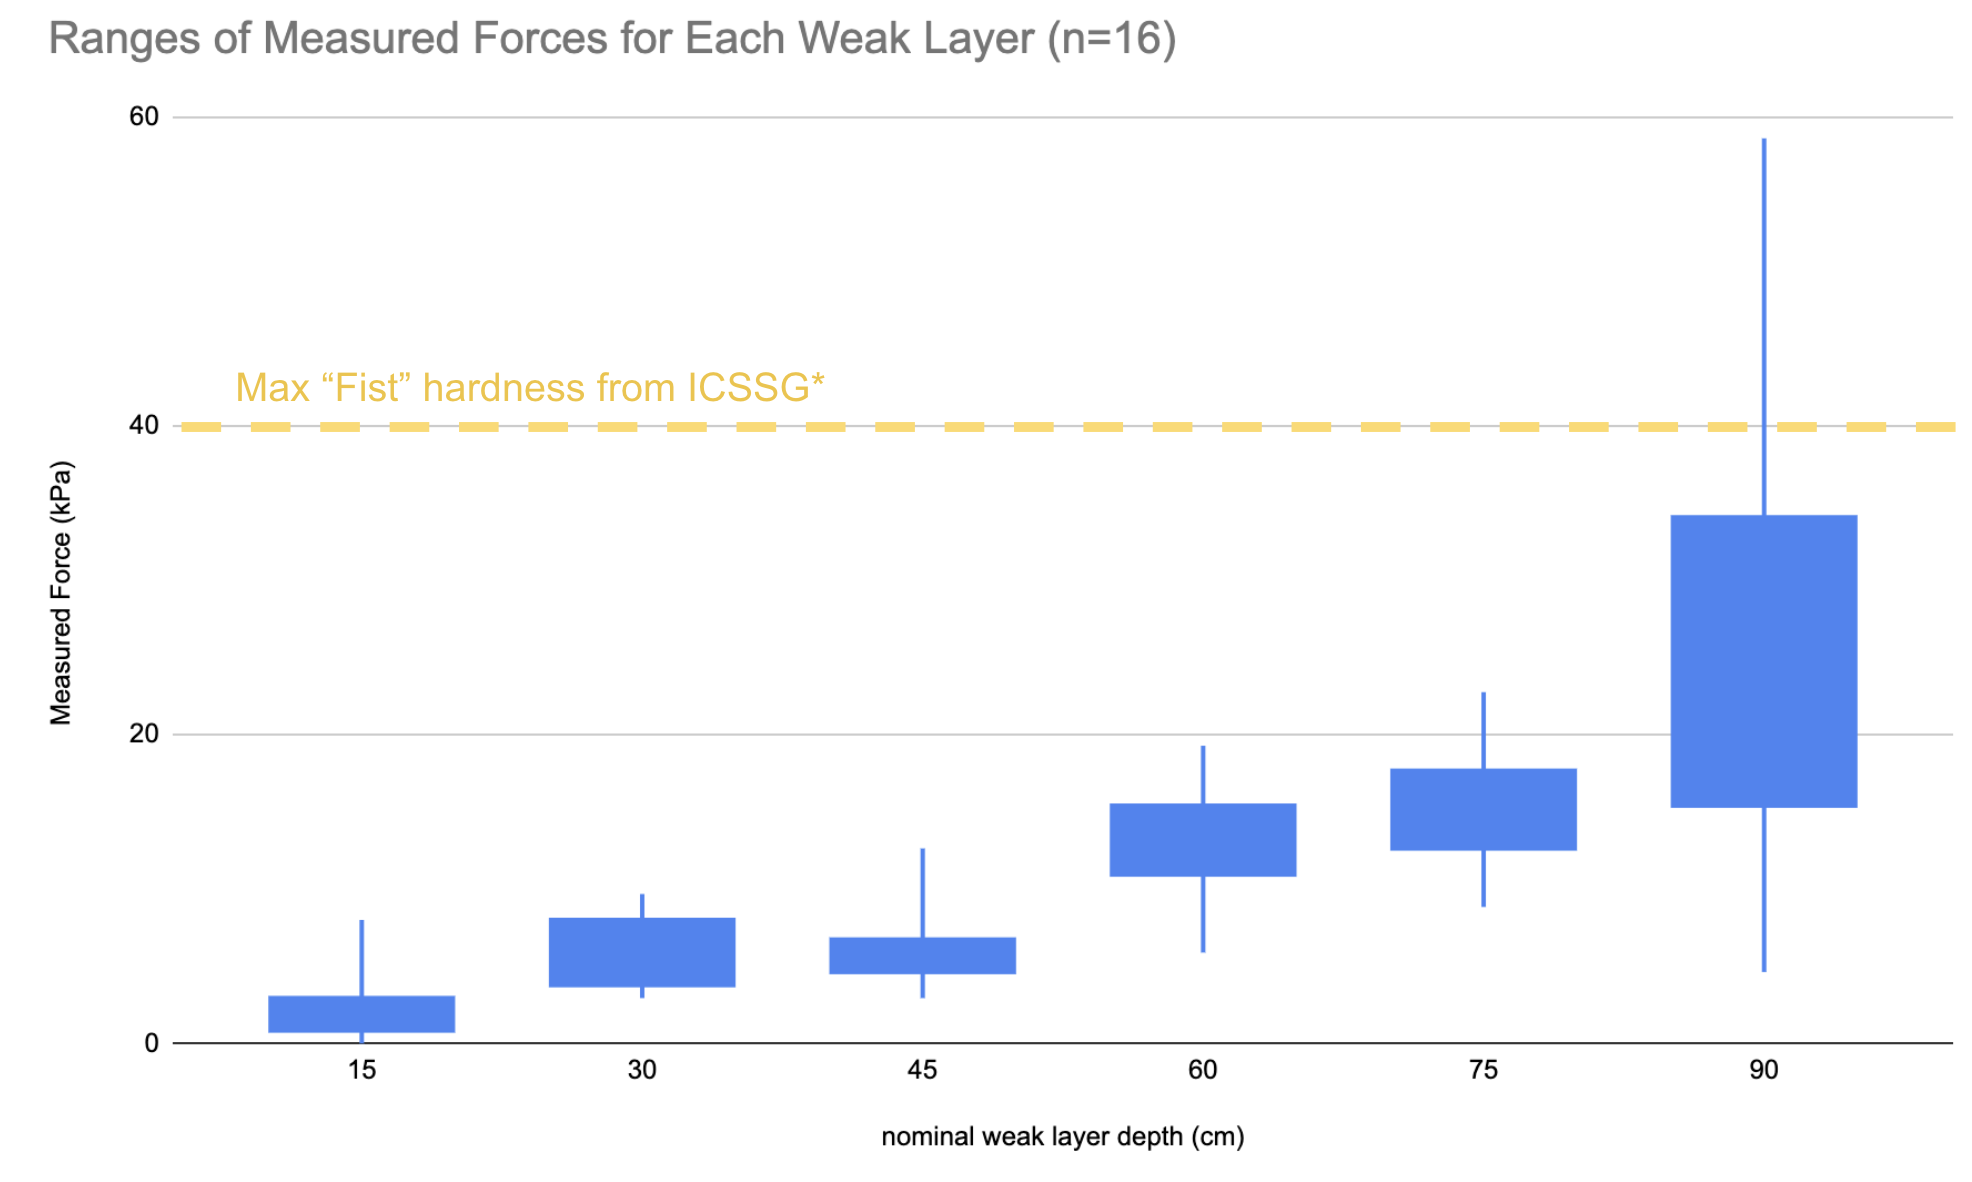
While the majority of the “weak layers” measured hardnesses were greater than 0, all except one was below the ICSSG threshold of 40kPa for fist hard snow. Additionally, all of these weak layer hardnesses were considerably less than the surrounding snowpack, meaning that they could be easily identifiable (even the outlier profile that had a single weak layer showing a hardness of about 58kPa).
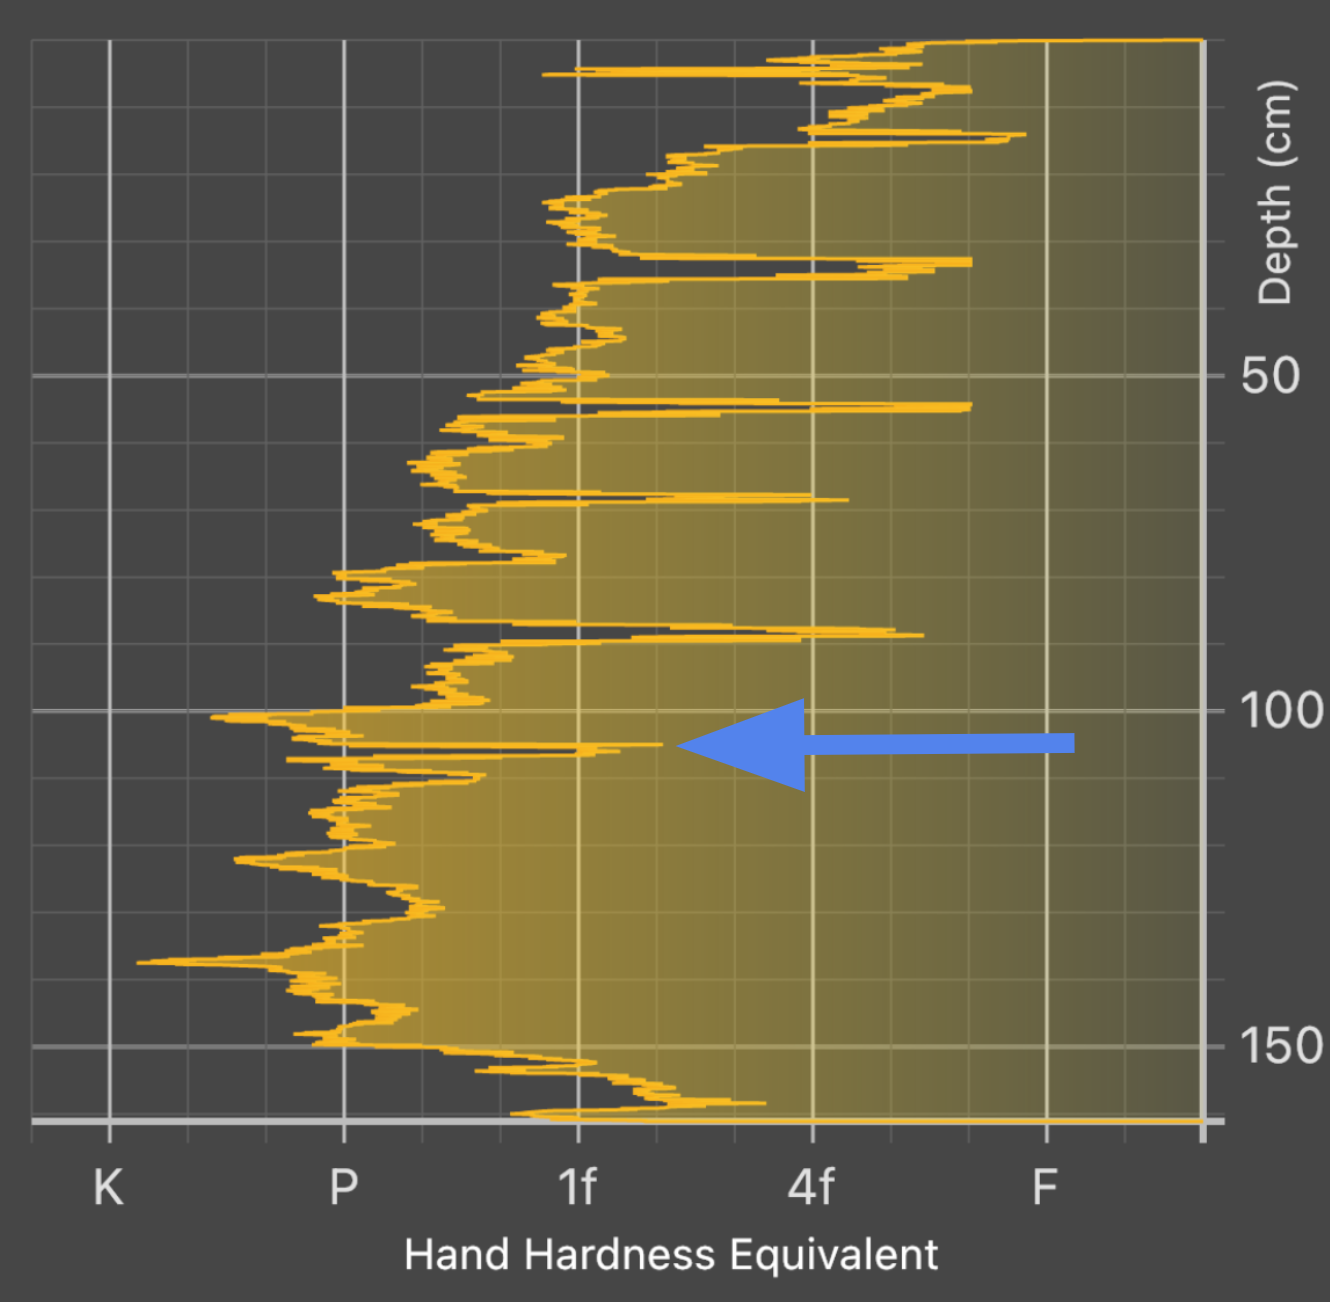
Profile from the dataset with the highest measured minimum layer hardness (58kPa). Still easily distinguishable from surrounding snow.
Another interesting thing to note is that the average measured hardness of the weak layers increased with depth of the weak layers ; the deepest layers showed higher average hardness than the shallower layers. At first pass, this doesn’t make sense as all layers should have the same hardness (0 kPa). However, when thinking about how the Snow Scope Probe actually measures hardness, this does make sense.


The tip of the Snow Scope Probe contains a force sensor that is connected to a cone shaped metal tip that is 6.5mm tall. Any snow contacting that tip is measured when pushing through the snow. If a weak layer (Ts in images) is thinner than the tip, there will never be a point in time when the entire tip is contained within the weak layer. This means that portions of the tip will be measuring the harder snow on top of or below the weak layer at the same time it is measuring the weak layer, creating an “averaged” hardness of the weak layer and the snow around it.
In the case of this experiment, the weak layers were 1.5mm thick (thinner than the 6.5mm tip), so it makes sense that the measured hardnesses were not 0, but instead a hardness greater than 0 but less than the surrounding snow. Because this particular snowpack trended harder with depth, it makes sense that the deeper weak layers showed a higher hardness (harder snow averaged with 0 hardness weak layer will have a higher value than softer snow averaged with 0).
While this is a simplification of how the snow dynamics in front of the Snow Scope Probe actually work, it does serve to explain why our measured weak layer hardnesses were greater than 0.
Takeaways and Limitations
While the theory, numbers, and charts here serve to form a foundational explanation of how the Snow Scope Probe identifies weak layers, the application of this information is much simpler.
The Snow Scope Probe can reliably identify weak layers, even down to as thin as 1.5mm (and potentially thinner). For tracking weak layers across space and time, this is very important - you can be confident that thin weak layers showing a hardness difference can be identified at a high level of depth accuracy! When combined with the Snow Scope’s ease of use and speed of collecting data, this makes the Snow Scope Probe unmatched in its ability to track, identify, and catalog weak layers!
The Snow Scope Probe identifies these weak layers on the basis of hardness - if you have a weak layer that is distinguishable by its grain type and not its hardness (ex: F hard buried surface hoar underneath F hard new snow), the Snow Scope Probe will not identify it.
Thanks for reading and if this went a bit over your head, we recommend checking out this blog post on what the Snow Scope is and how it works.